A cross-platform weather statistics application in Ruby
clinic-answer-weather-ruby
Weather Statistics Desktop Application
Example answer to the Lake Pend Oreille weather challenge of the LinkedIn Learning: Code Clinic: Ruby.
Note that this is my first Ruby application. The learning curve was moderate.
Derived requirements:
- The application should be cross-platform between Windows 10 Pro 20H2, Ubuntu 2018.04 LTS, and macOS 10.15 Catalina.
- The application should be possible to distribute closed-source by not relying upon a copy-left graphical toolkit or chart plotting library.
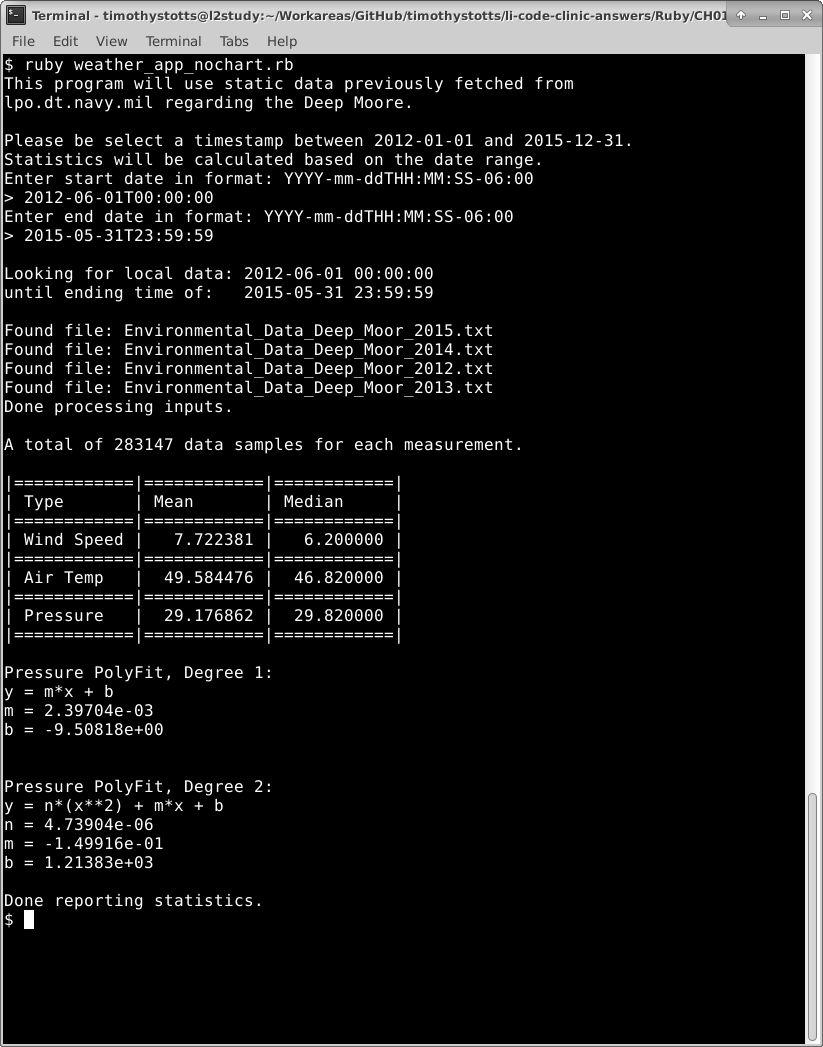
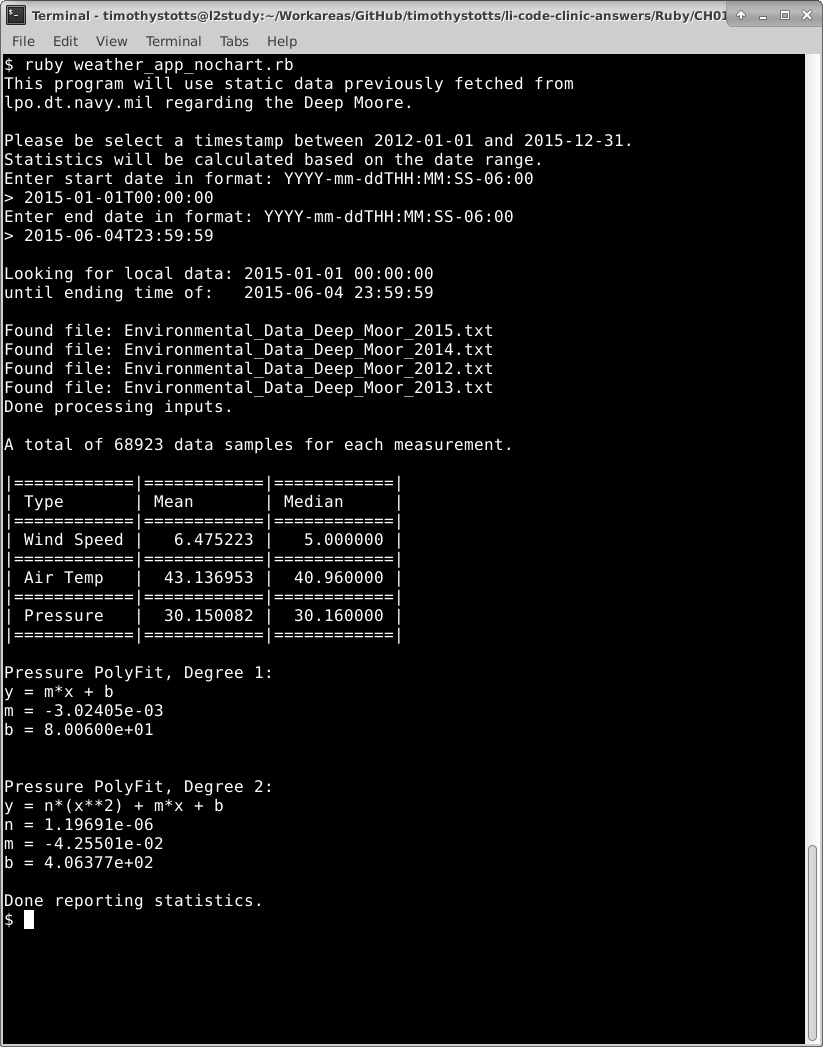
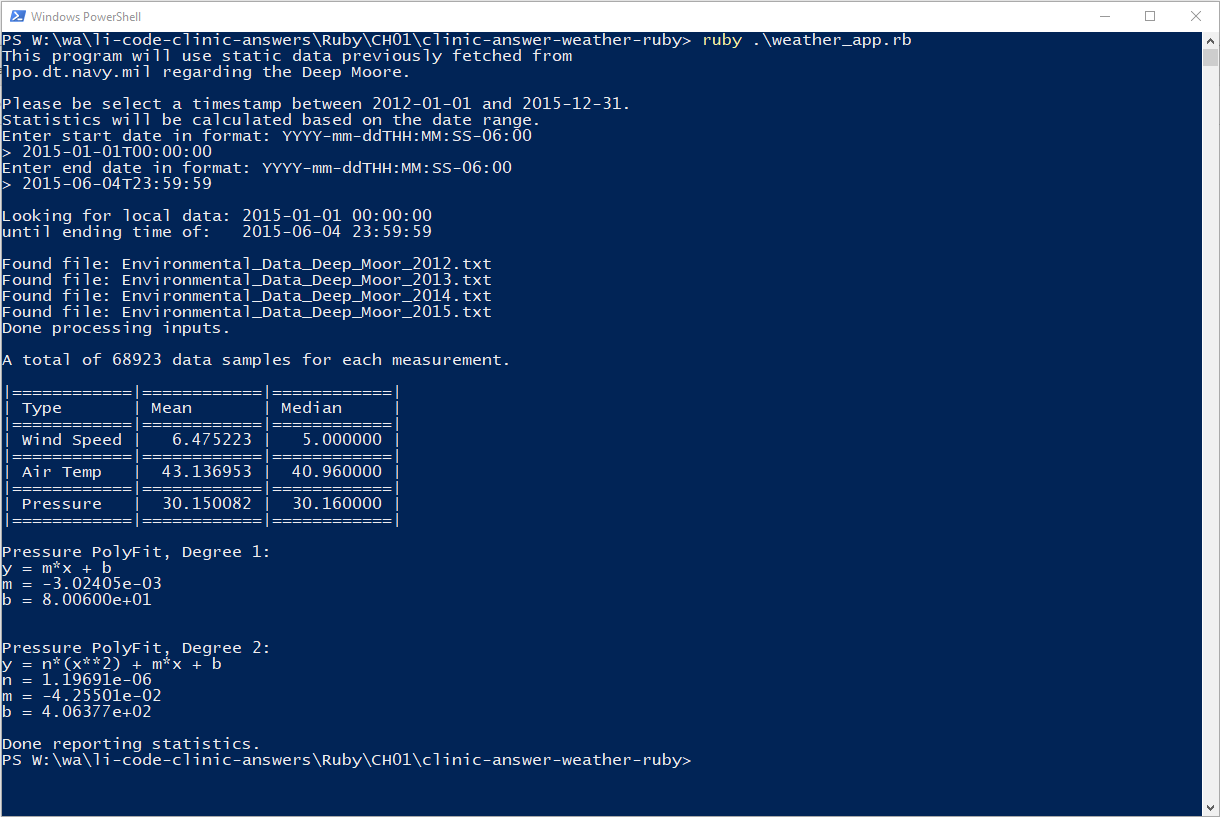
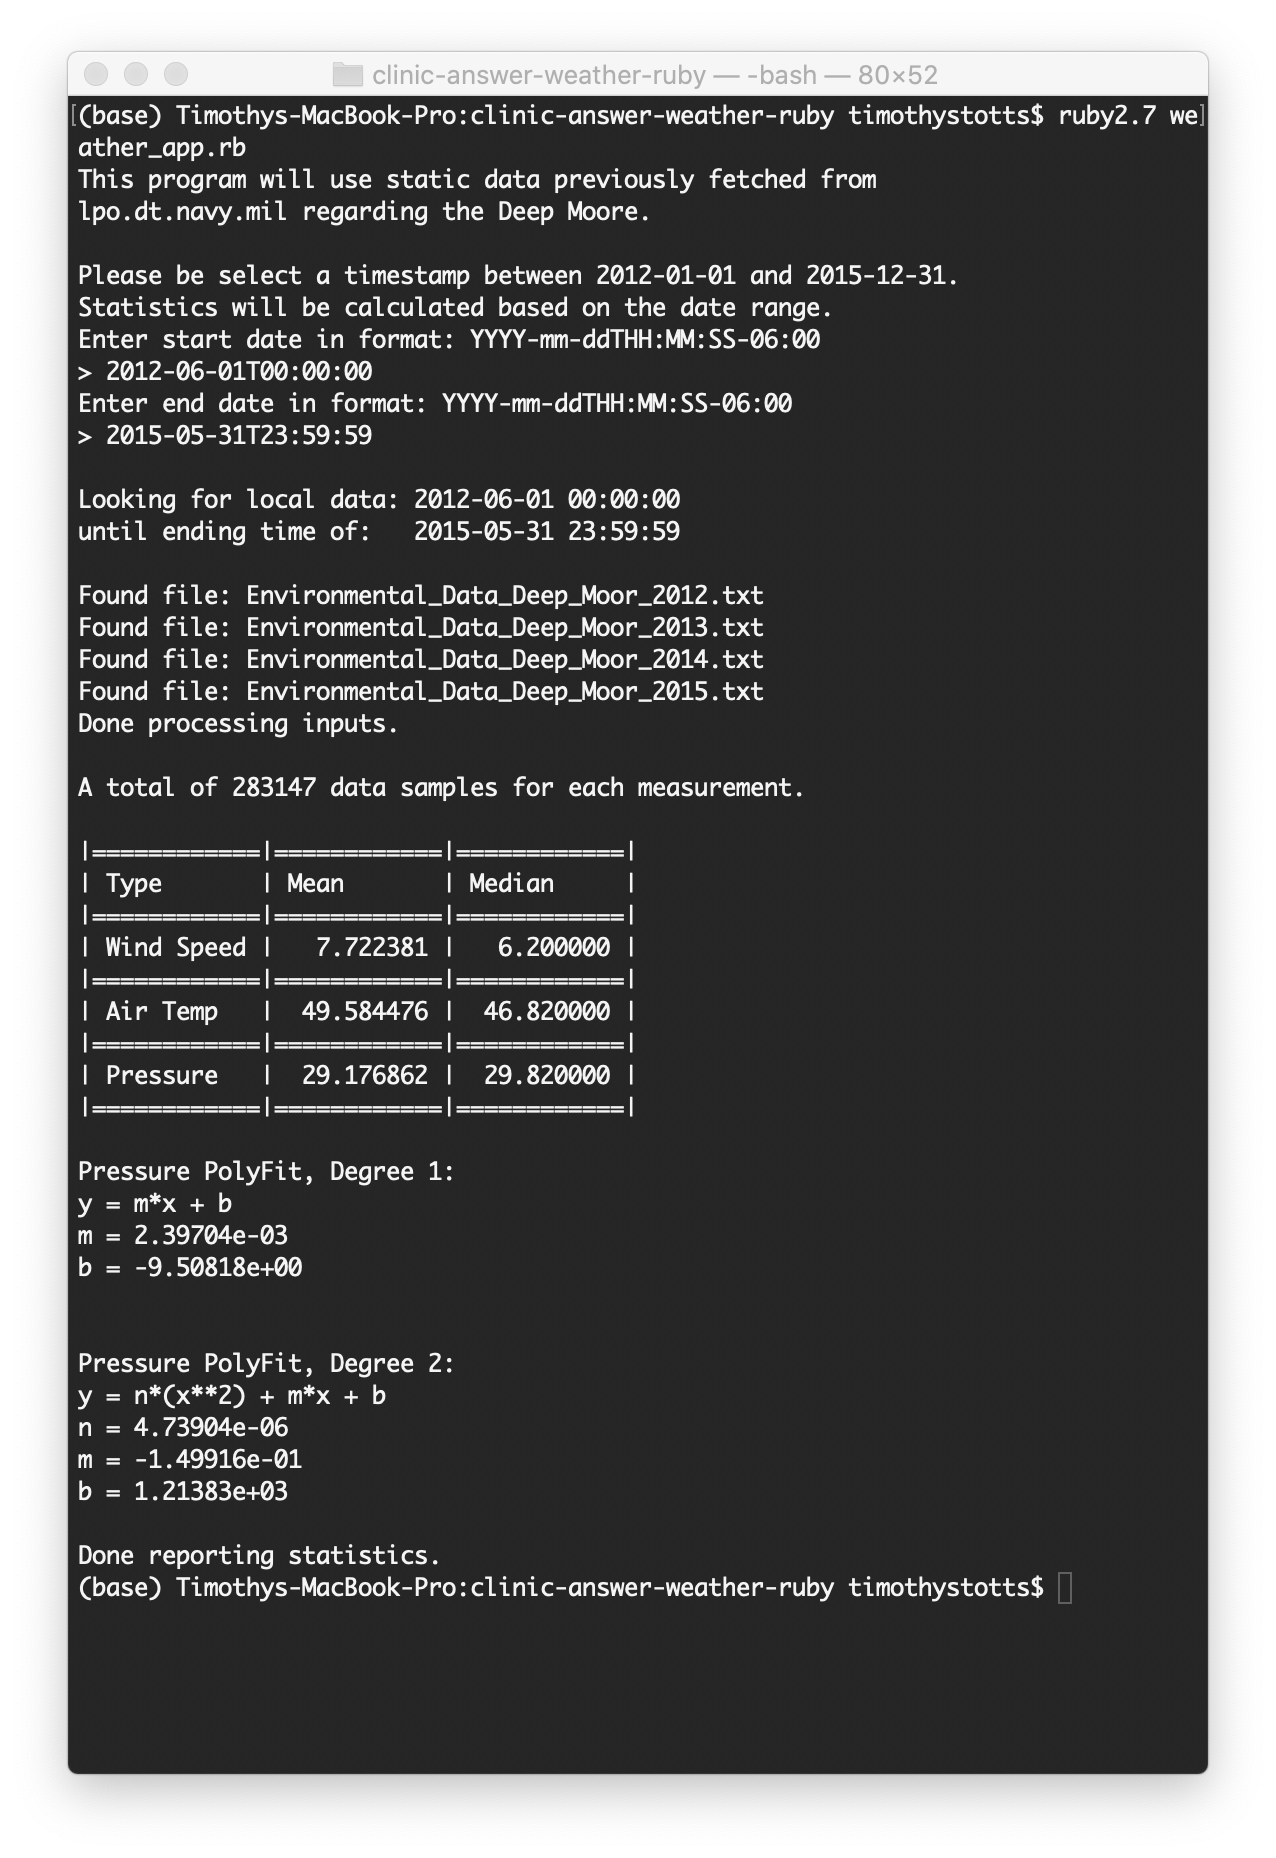
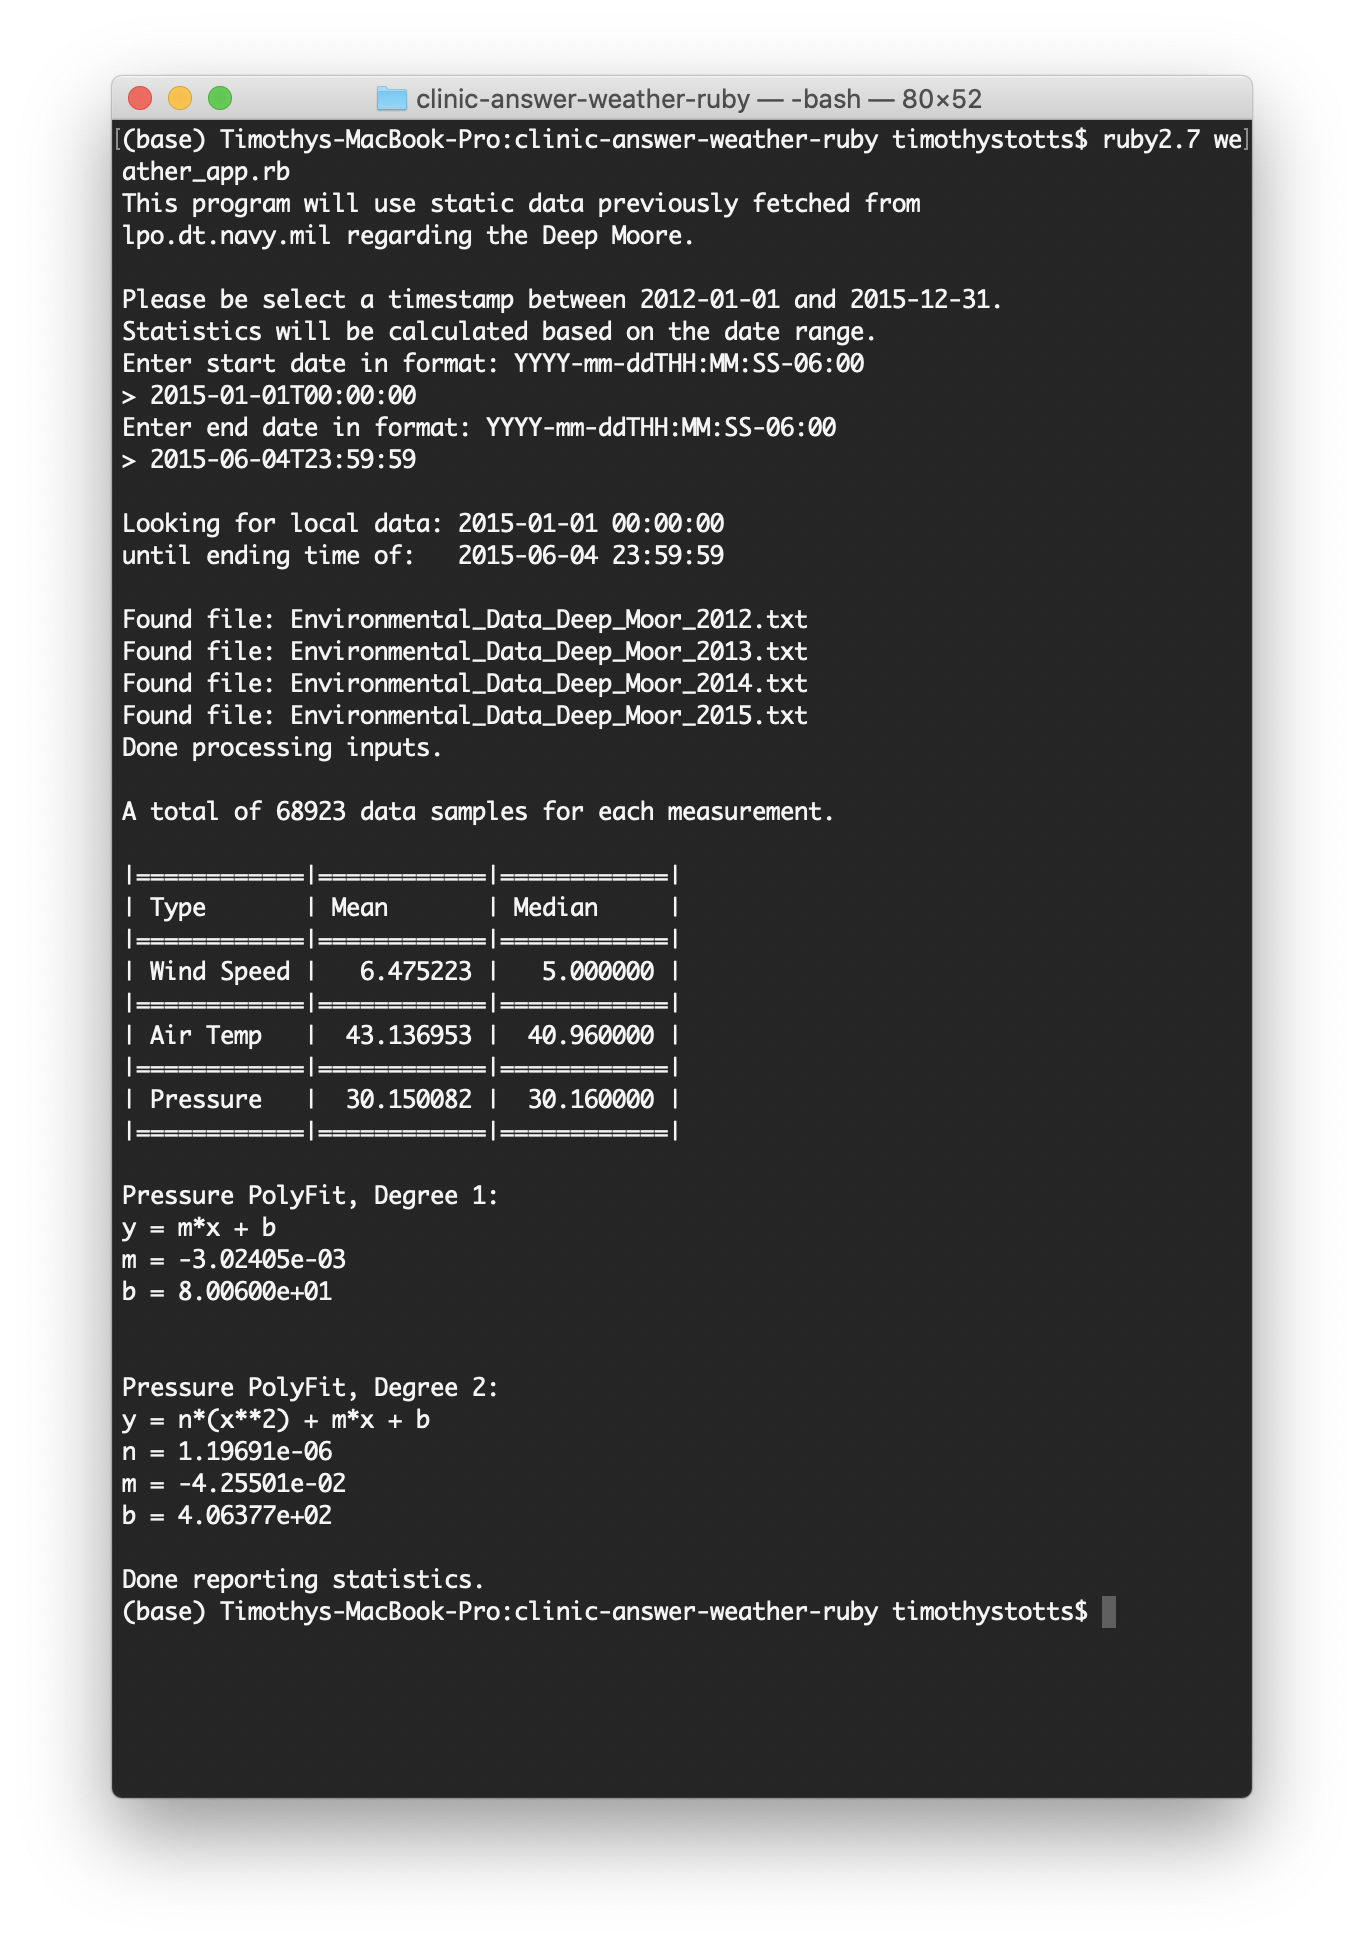
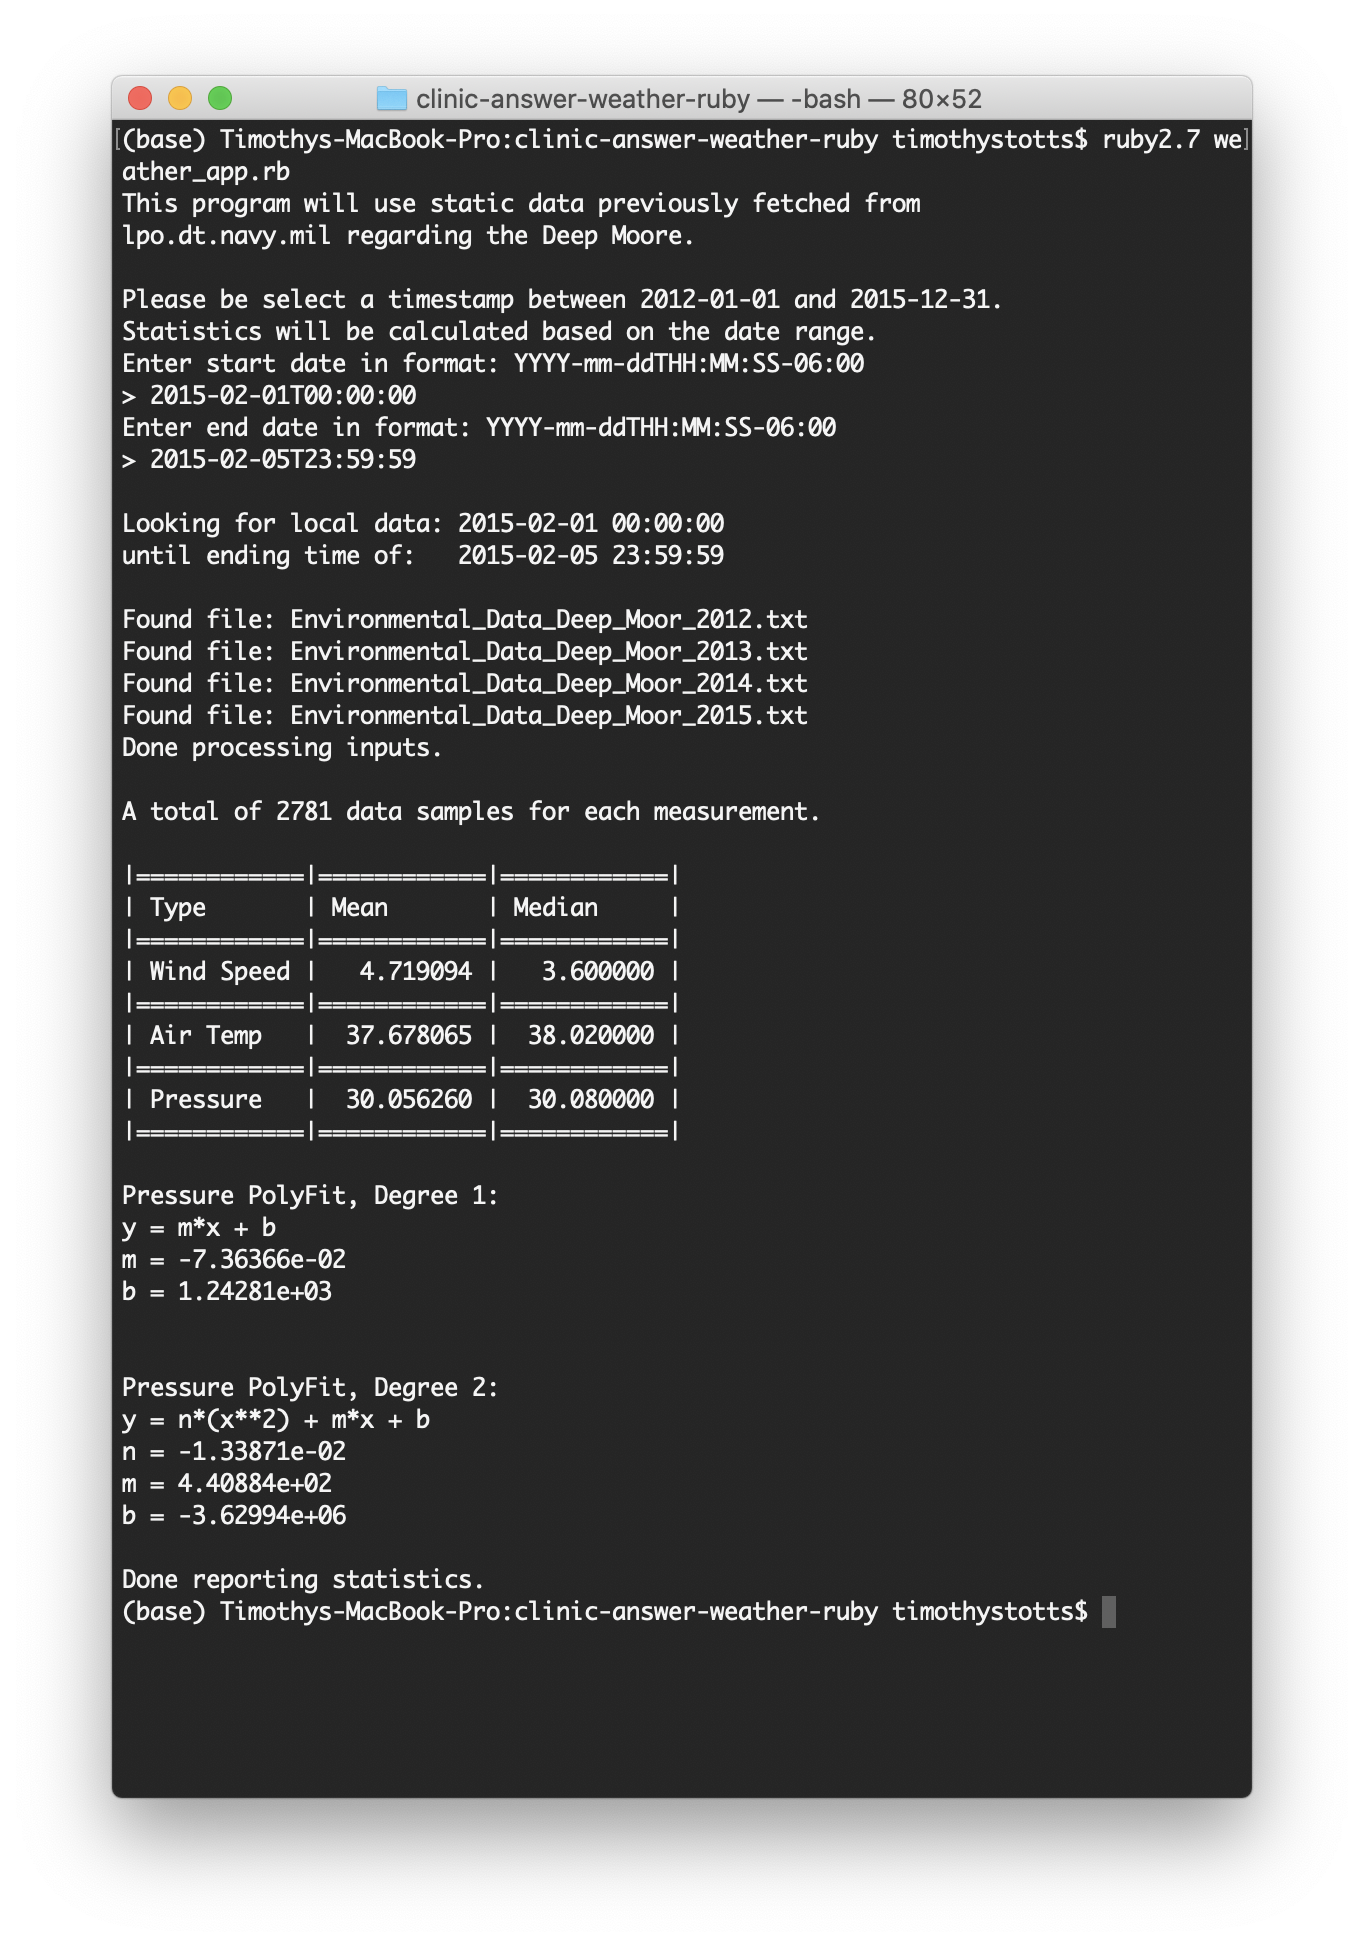
- The application should print mean and median statistics within a selectable date-time range of these weather readings: Wind Speed, Air Temperature, Barometric Pressure.
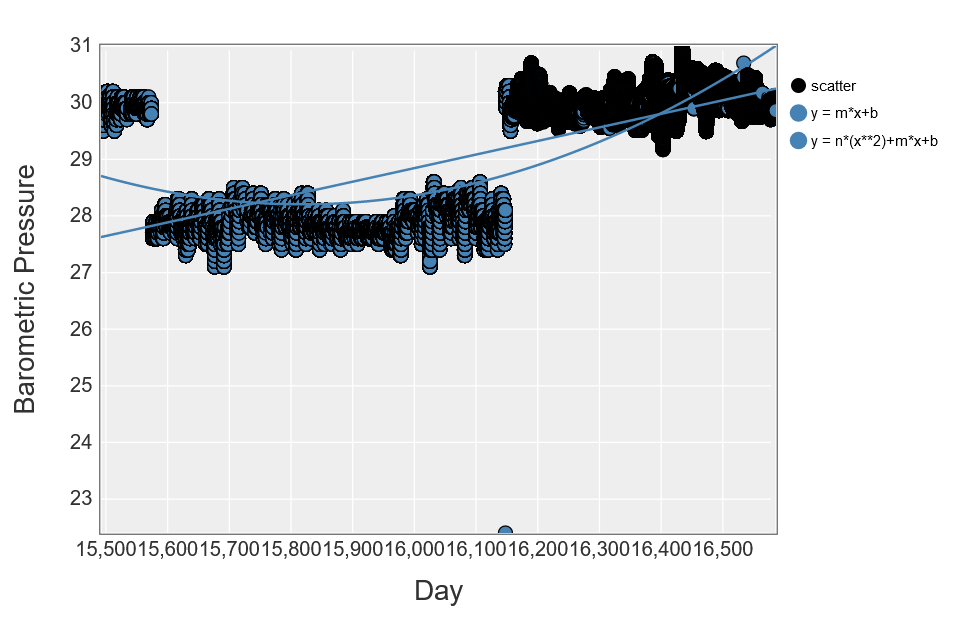
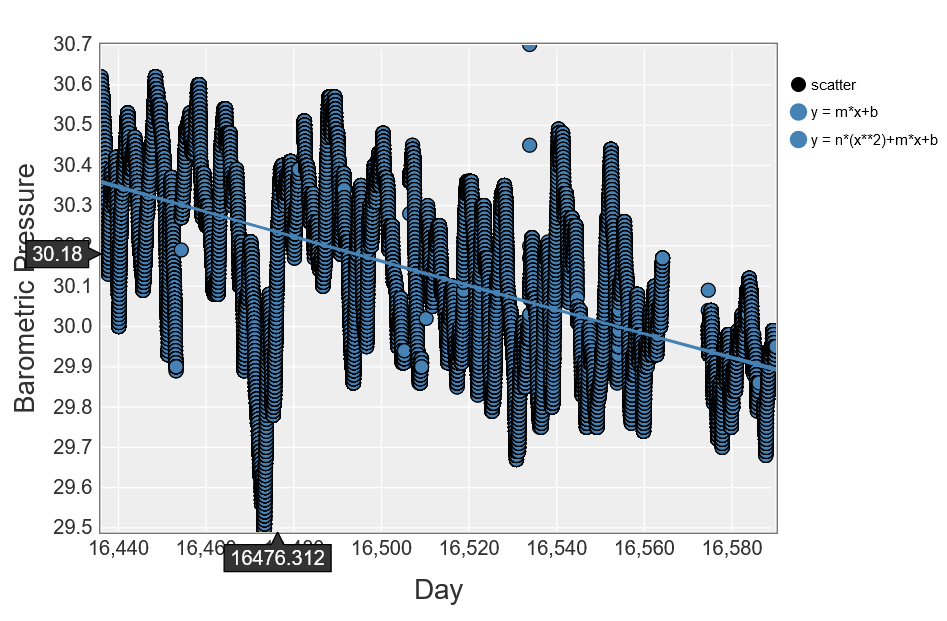
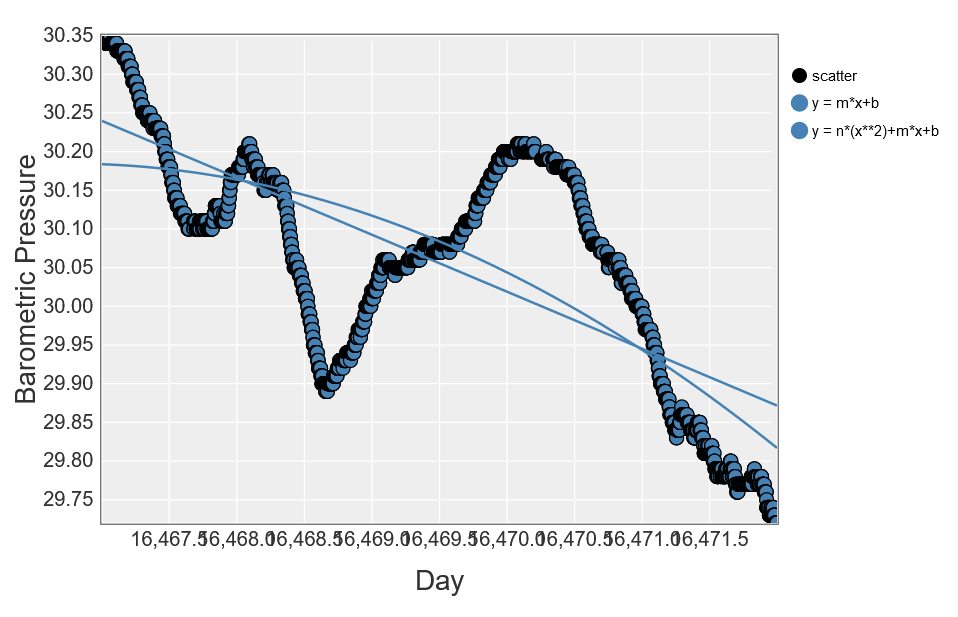
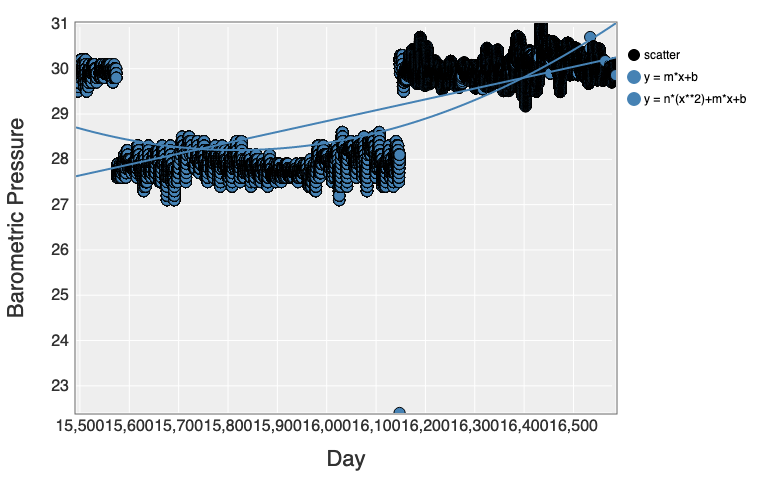
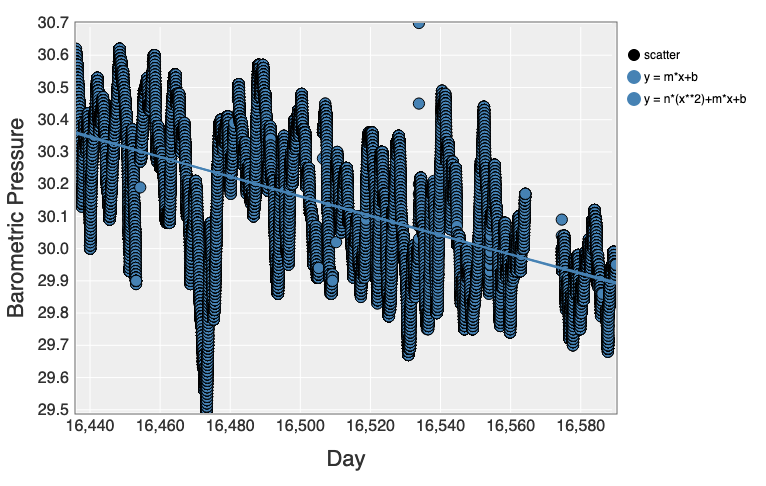
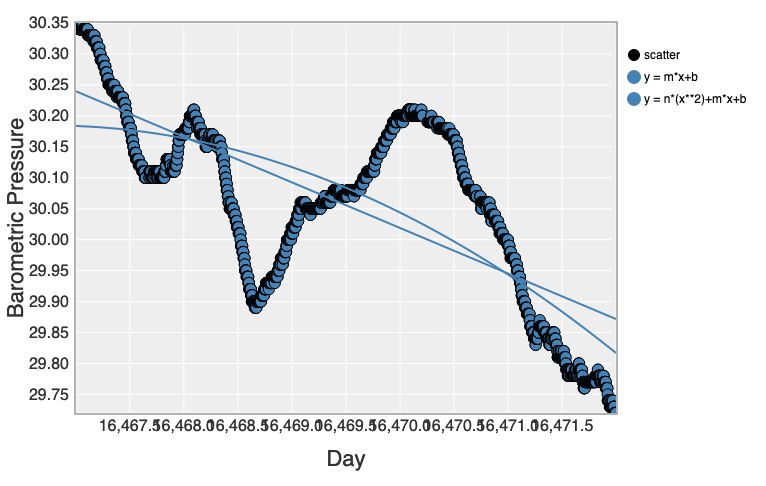
- The application should graphically chart plot the Barometric Pressure readings within the same selected date-time range.
- The application should chart plot the linear and quadratic trends on the chart plot within the same selected date-time range, noting that the Intercept value of the Linear Regressoin will be the same as the Python 3 example because of Ruby’s Time object using 1970 as Epoch instead of 0001.
- The application should state the linear and quadratic trend equations in plain text that can be copy-pasted.
Refined requirements:
- The application shall use printing to Standard Output to display resuls.
- The application shall use ‘nyaplot’ to generate a HTML chart viewable by the Mozilla Firefox web browser.
- The application shall use ‘matrix’ as necessary to perform polynomial regression.
- Examples in the blog post shall only give hints.
Example screen shots of the completed application:
Weather Analysis App on Ubuntu 18.04 LTS.

Weather Analysis App on Windows 10 Pro 20H2.


Weather Analysis App on macOS Catalina.
Hints for cross-platform design
Observations on the Polyfit regression coefficients
It is noteworthy that the coefficients are the same between this Ruby application and the previously discussed Python 3 application. This is due to the same date representations as days from Epoch 1970.
A Polynomial Regression algorithm was leveraged from the Rosetta website page on Polynomial Regression:
    ##
    # The Polynomial Regression code was leveraged from:
    #     https://rosettacode.org/wiki/Polynomial_regression#Ruby
    #
    def self.PolyFit(x, y, degree)
        x_data = x.map { |xi| (0..degree).map { |pow| (xi**pow).to_r } }

        mx = Matrix[*x_data]
        my = Matrix.column_vector(y)

        ((mx.t * mx).inv * mx.t * my).transpose.to_a[0].map(&:to_f)
    end
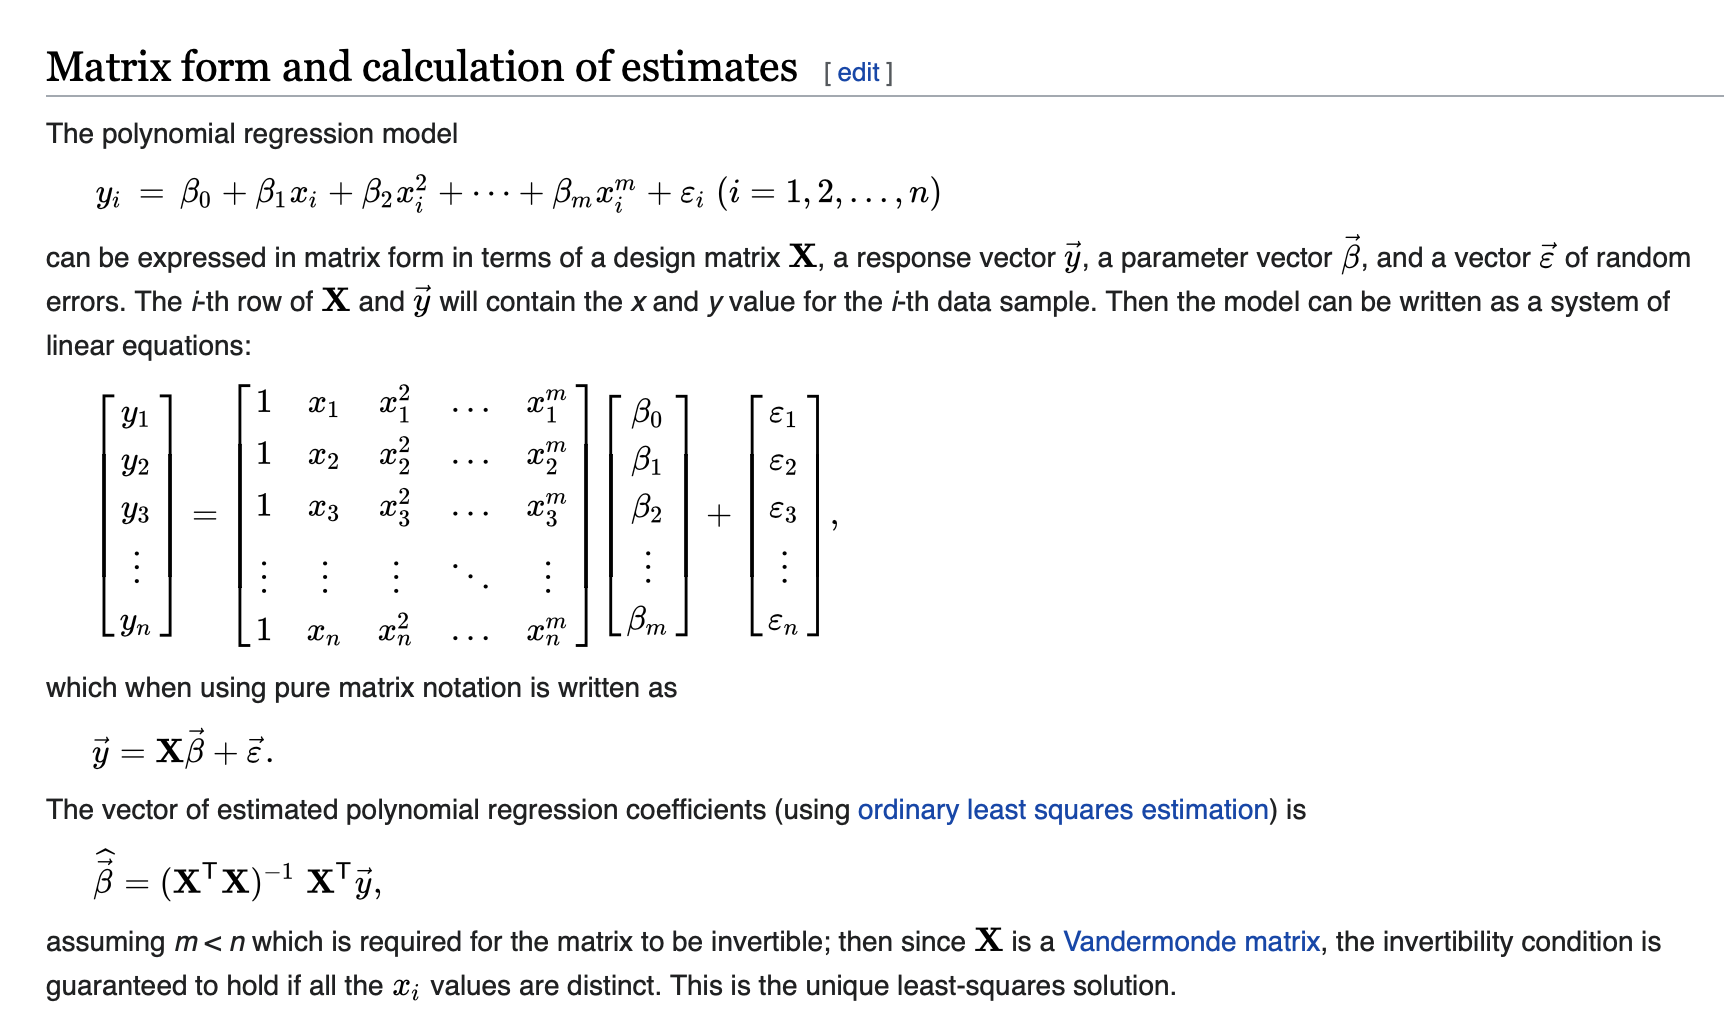
This algorithm implements in Ruby, using the gem ‘matrix’, the matrix form of the Polynomial Regression formula, with Rational Numbers. Note that this is the same as implementing the Matrix form of Polynomial Regression detailed on Wikipedia; and then converting the resulting matrix column to a normal array of floats of the regression coefficients.
Installing matrix and nyaplot
gem install --user-install bundler matrix nyaplot
For macOS 10.15 and Windows 10, the ‘nyaplot’ package worked as expected.
However, on Ubuntu 18.04 with the Ruby 2.7.2 snap installed, the nyaplot gem
failed to install. The gem command indicated a successful install; but the
command gem list --local did not display the gem as installed. Also, any
script (or irb line) failed for:
require 'nyaplot'
Due to this, a script omitting the nyaplot logic was executed on Ubuntu.
Viewing nyaplot scatter plot charts
It was noteworthy that the Safari and Edge browsers could not load a > 40 MiB
web page produced by nyaplot; but that Firefox could. Firefox required over
2 GiB of RAM to load the Main plot having 283147 discrete samples.