A cross-platform weather statistics application in Python 3
clinic-answer-weather-python
Weather Statistics Desktop Application
Example answer to the Lake Pend Oreille weather challenge of the LinkedIn Learning: Code Clinic: Python.
Note that this is not my first wxPython 4 application, nor my first Matplotlib design. The learning curve was moderate.
Derived requirements:
- The application should be cross-platform between Windows 10 Pro 20H2, Ubuntu 2018.04 LTS, and macOS 10.15 Catalina.
- The application should be possible to distribute closed-source by not relying upon a copy-left graphical toolkit or chart plotting library.
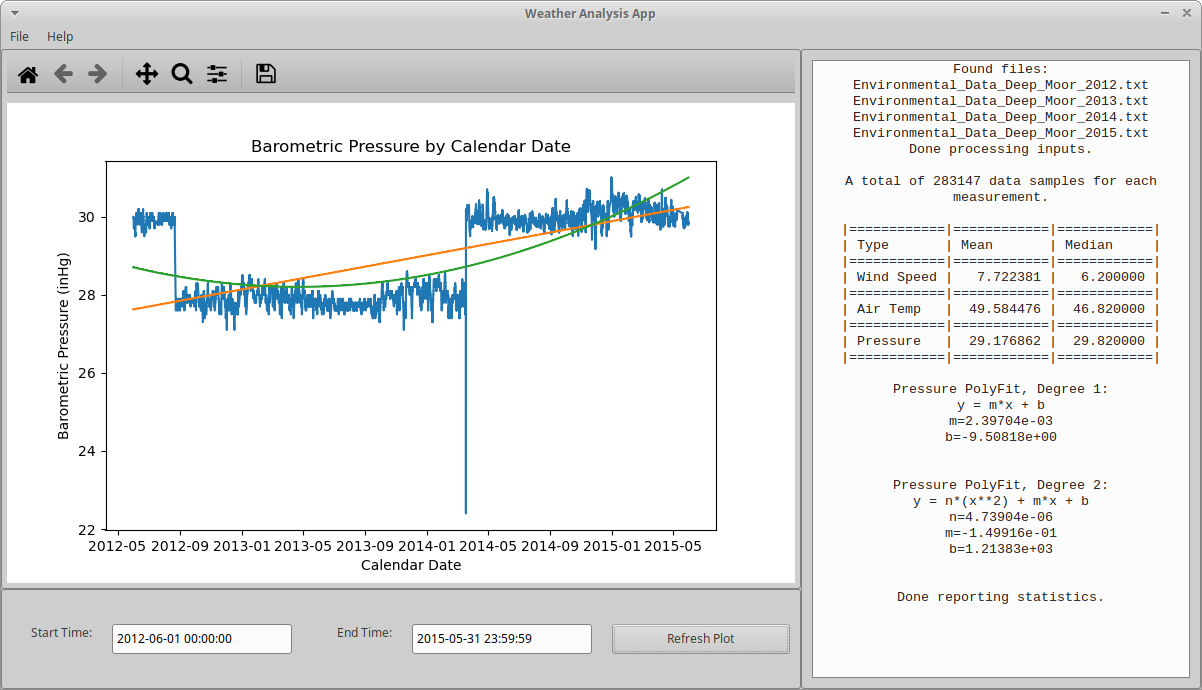
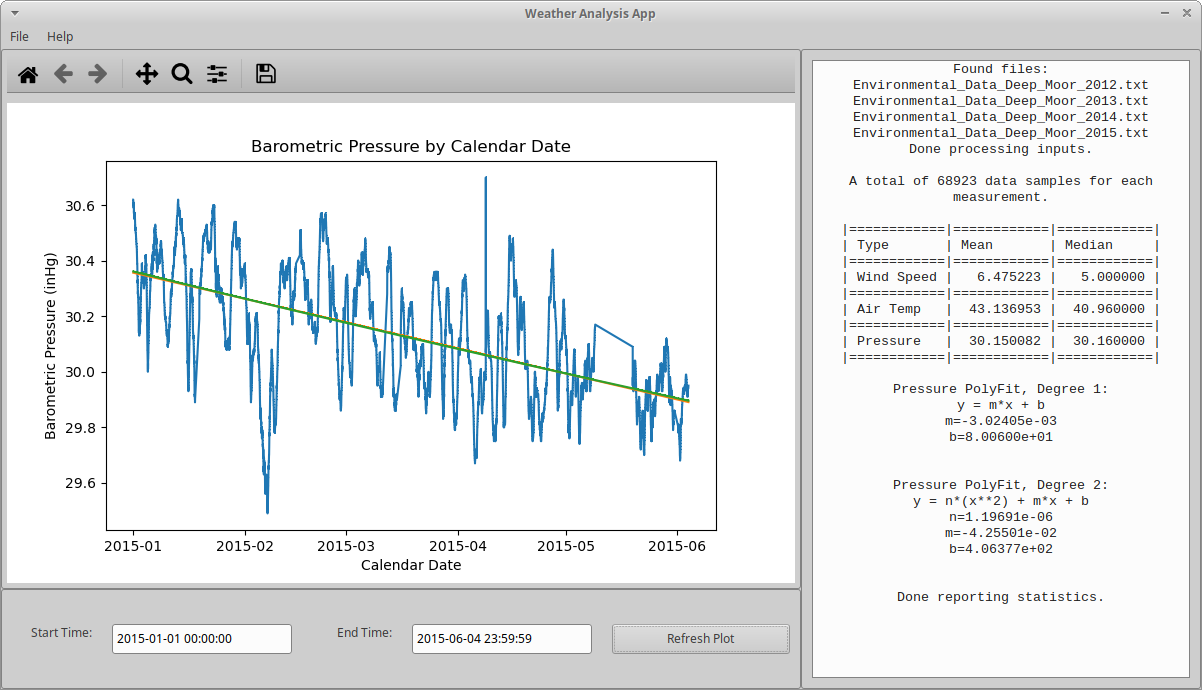
- The application should print mean and median statistics within a selectable date-time range of these weather readings: Wind Speed, Air Temperature, Barometric Pressure.
- The application should graphically chart plot the Barometric Pressure readings within the same selected date-time range.
- The application should chart plot the linear and quadratic trends on the chart plot within the same selected date-time range, noting that the Intercept value of the Linear Regressoin will differ because of Matplotlib’s recent change to use 1970 as Epoch instead of 0001.
- The application should state the linear and quadratic trend equations in plain text that can be copy-pasted.
Refined requirements:
- The application shall use the wxWidgets 3.0.x/3.1.x graphical toolkit via wxPython 4.x for the design of the window frame and controls.
- The application shall use Matplotlib to chart plot data upon a wx.Panel window object of the wxPython window frame.
- The application shall use numpy as necessary to create performance arrays.
- The Anaconda3 2020.11 distribution shall be used as the Python 3 installation of choice.
- Examples in the blog post shall only give hints.
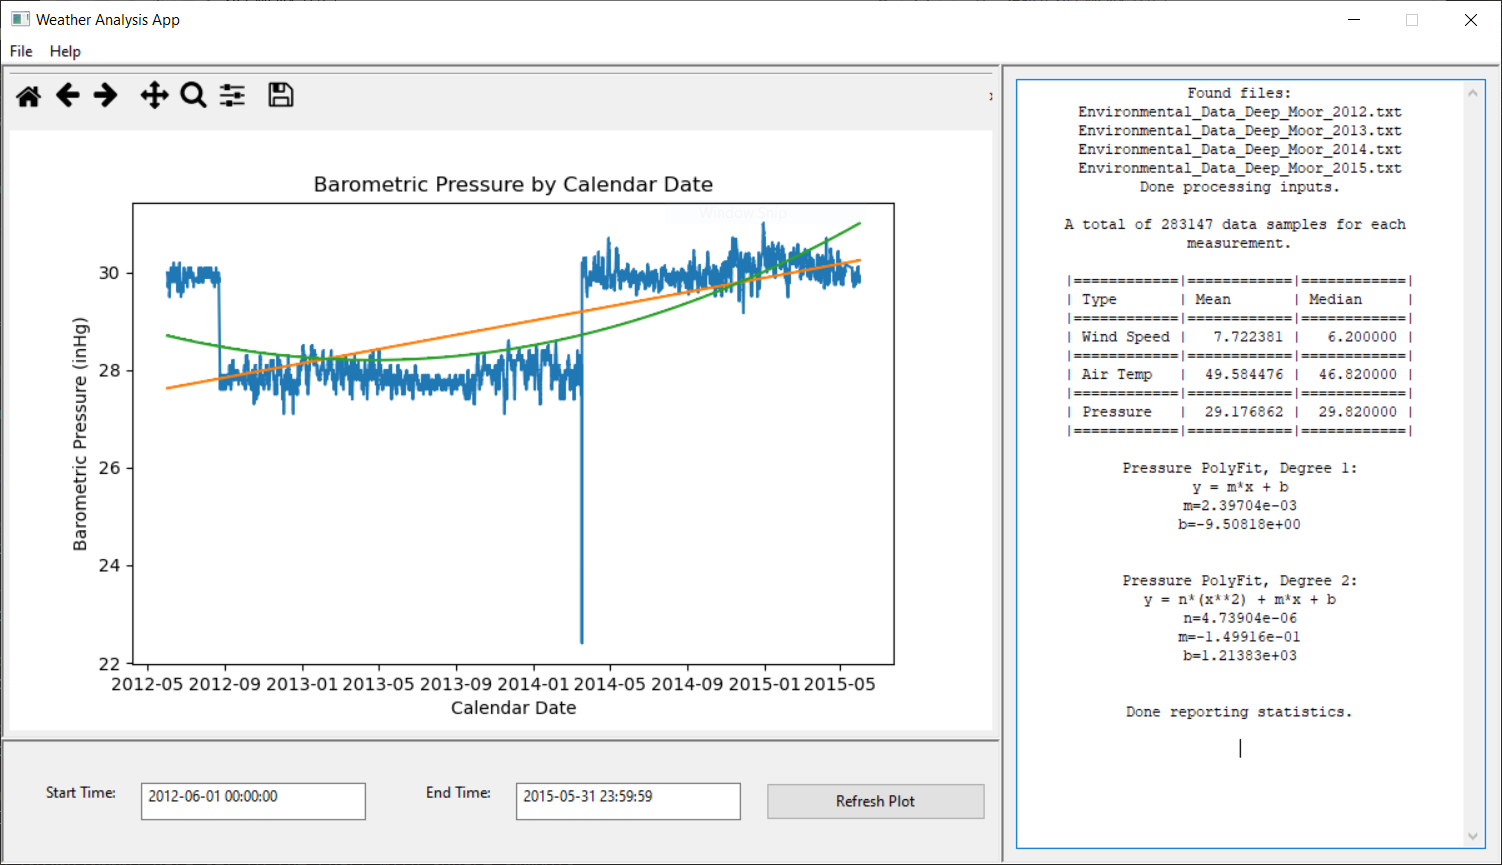
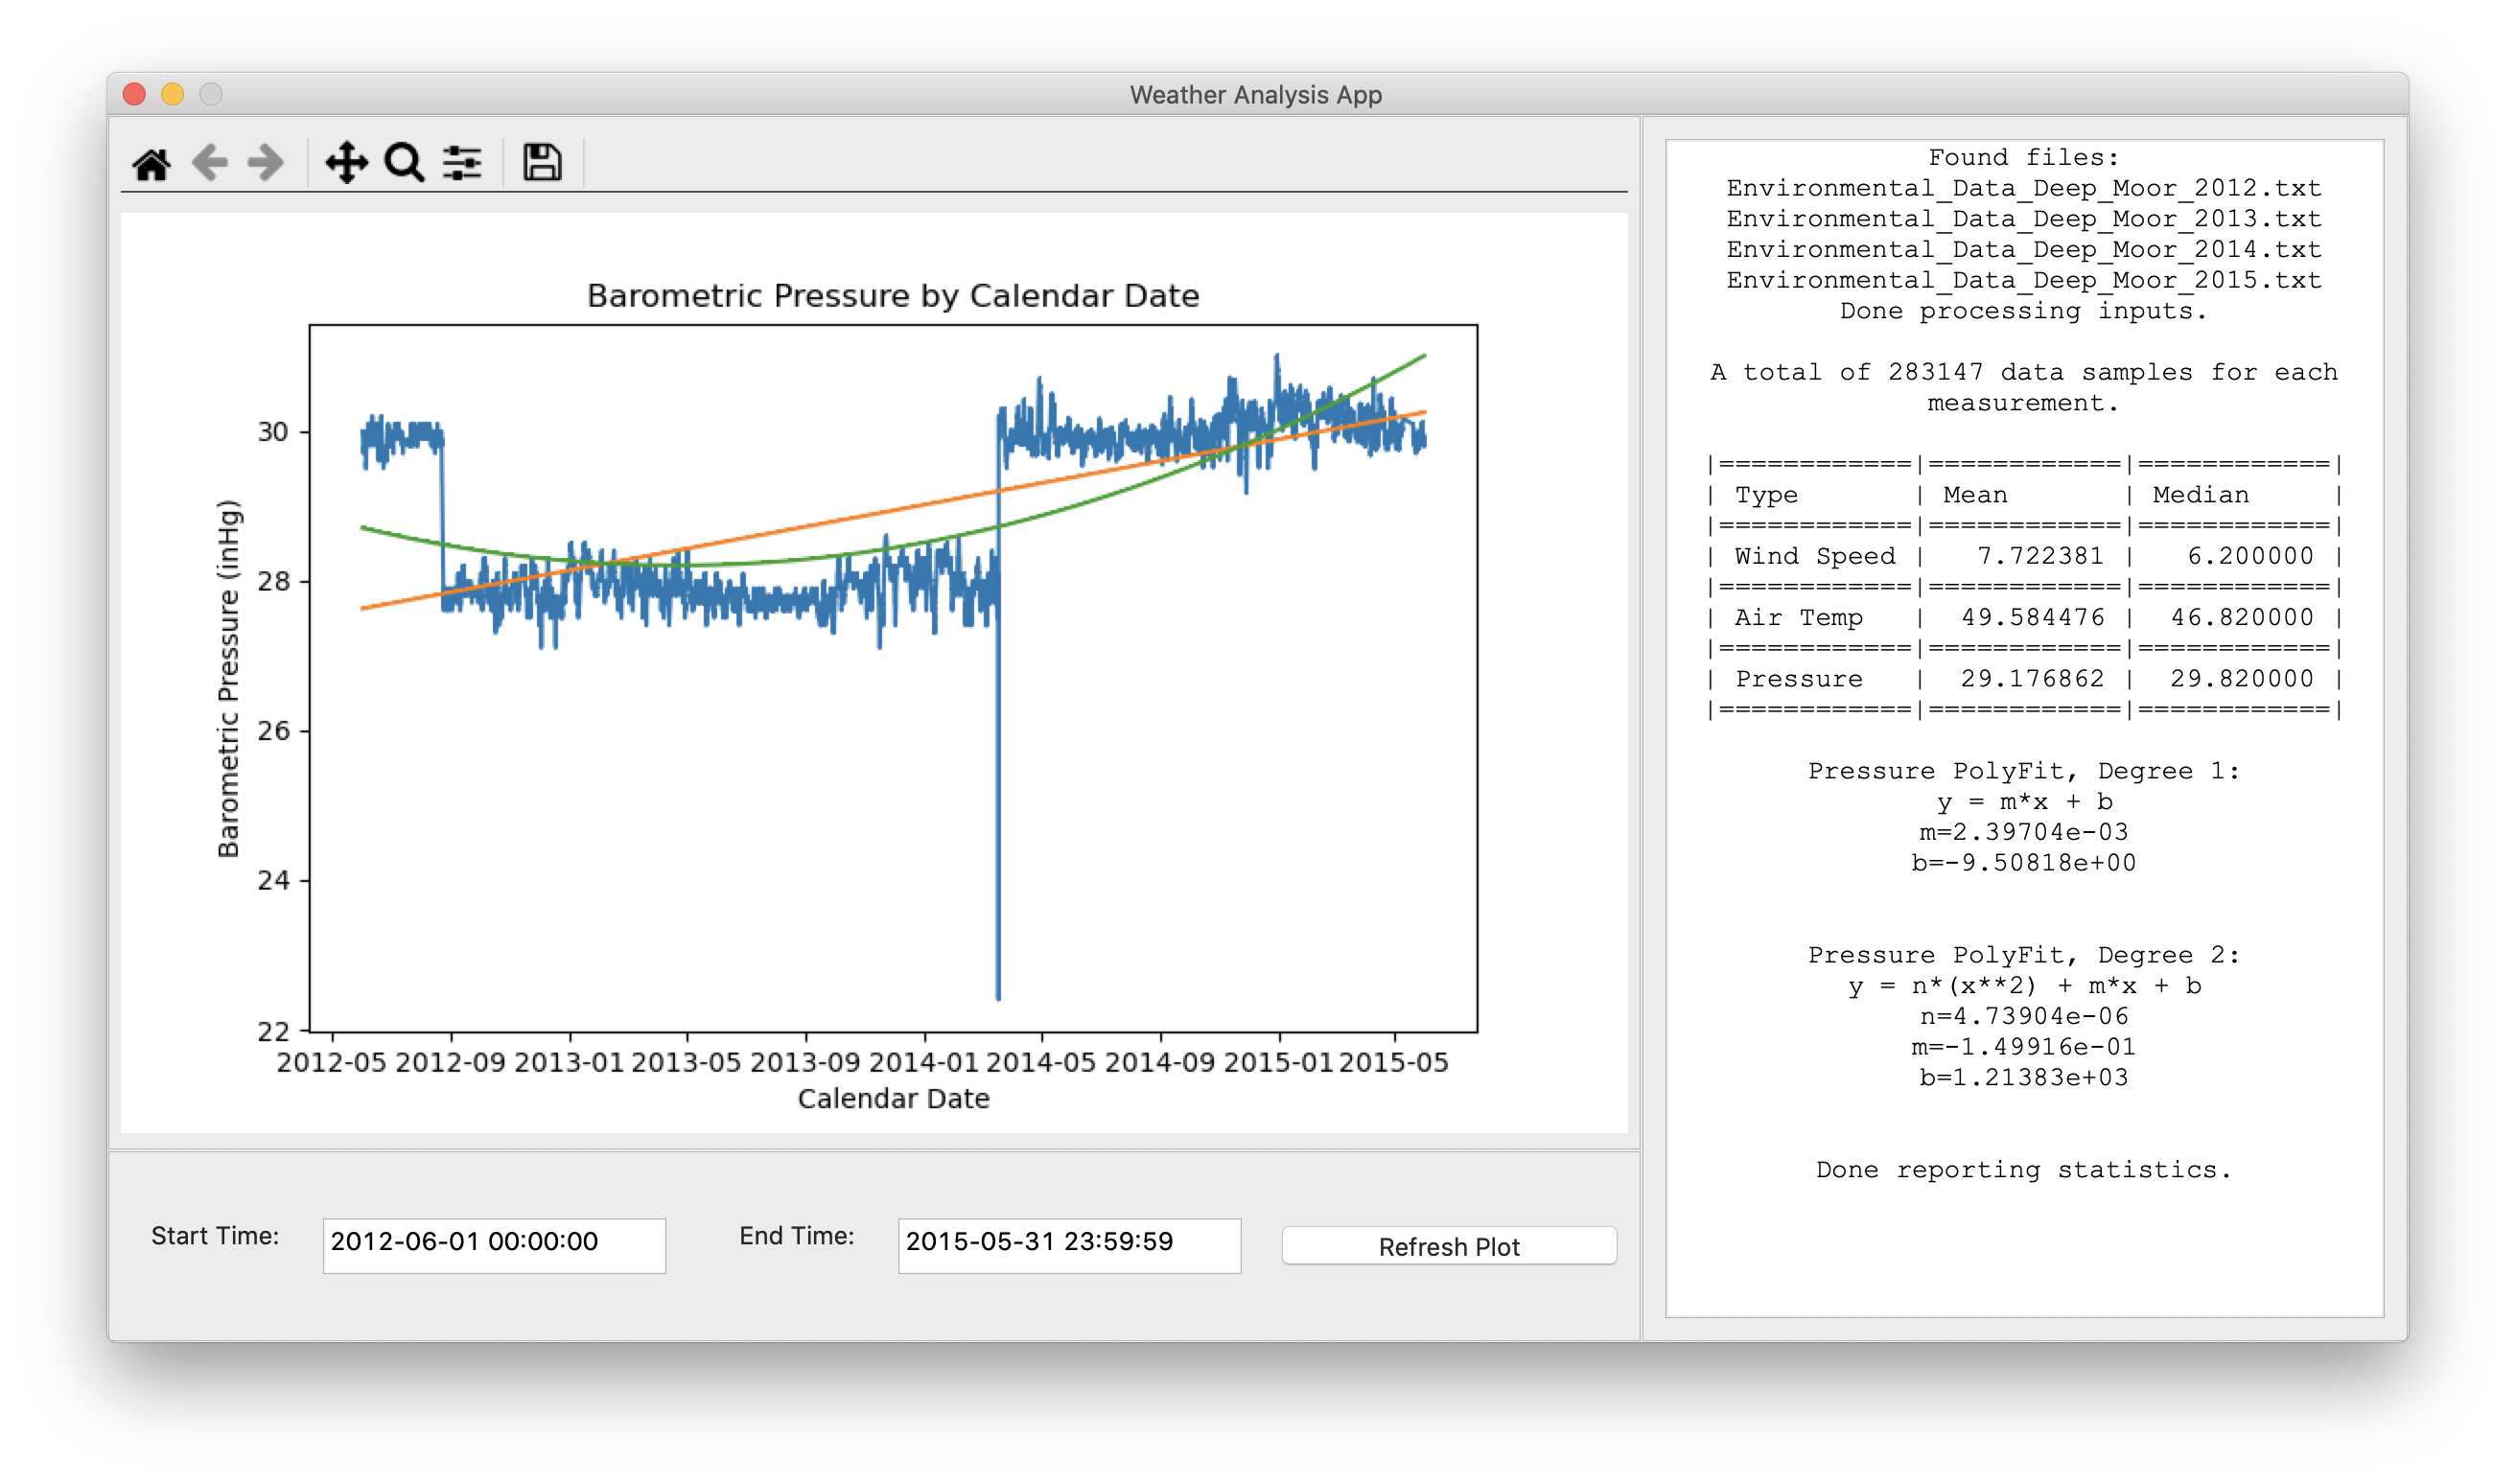
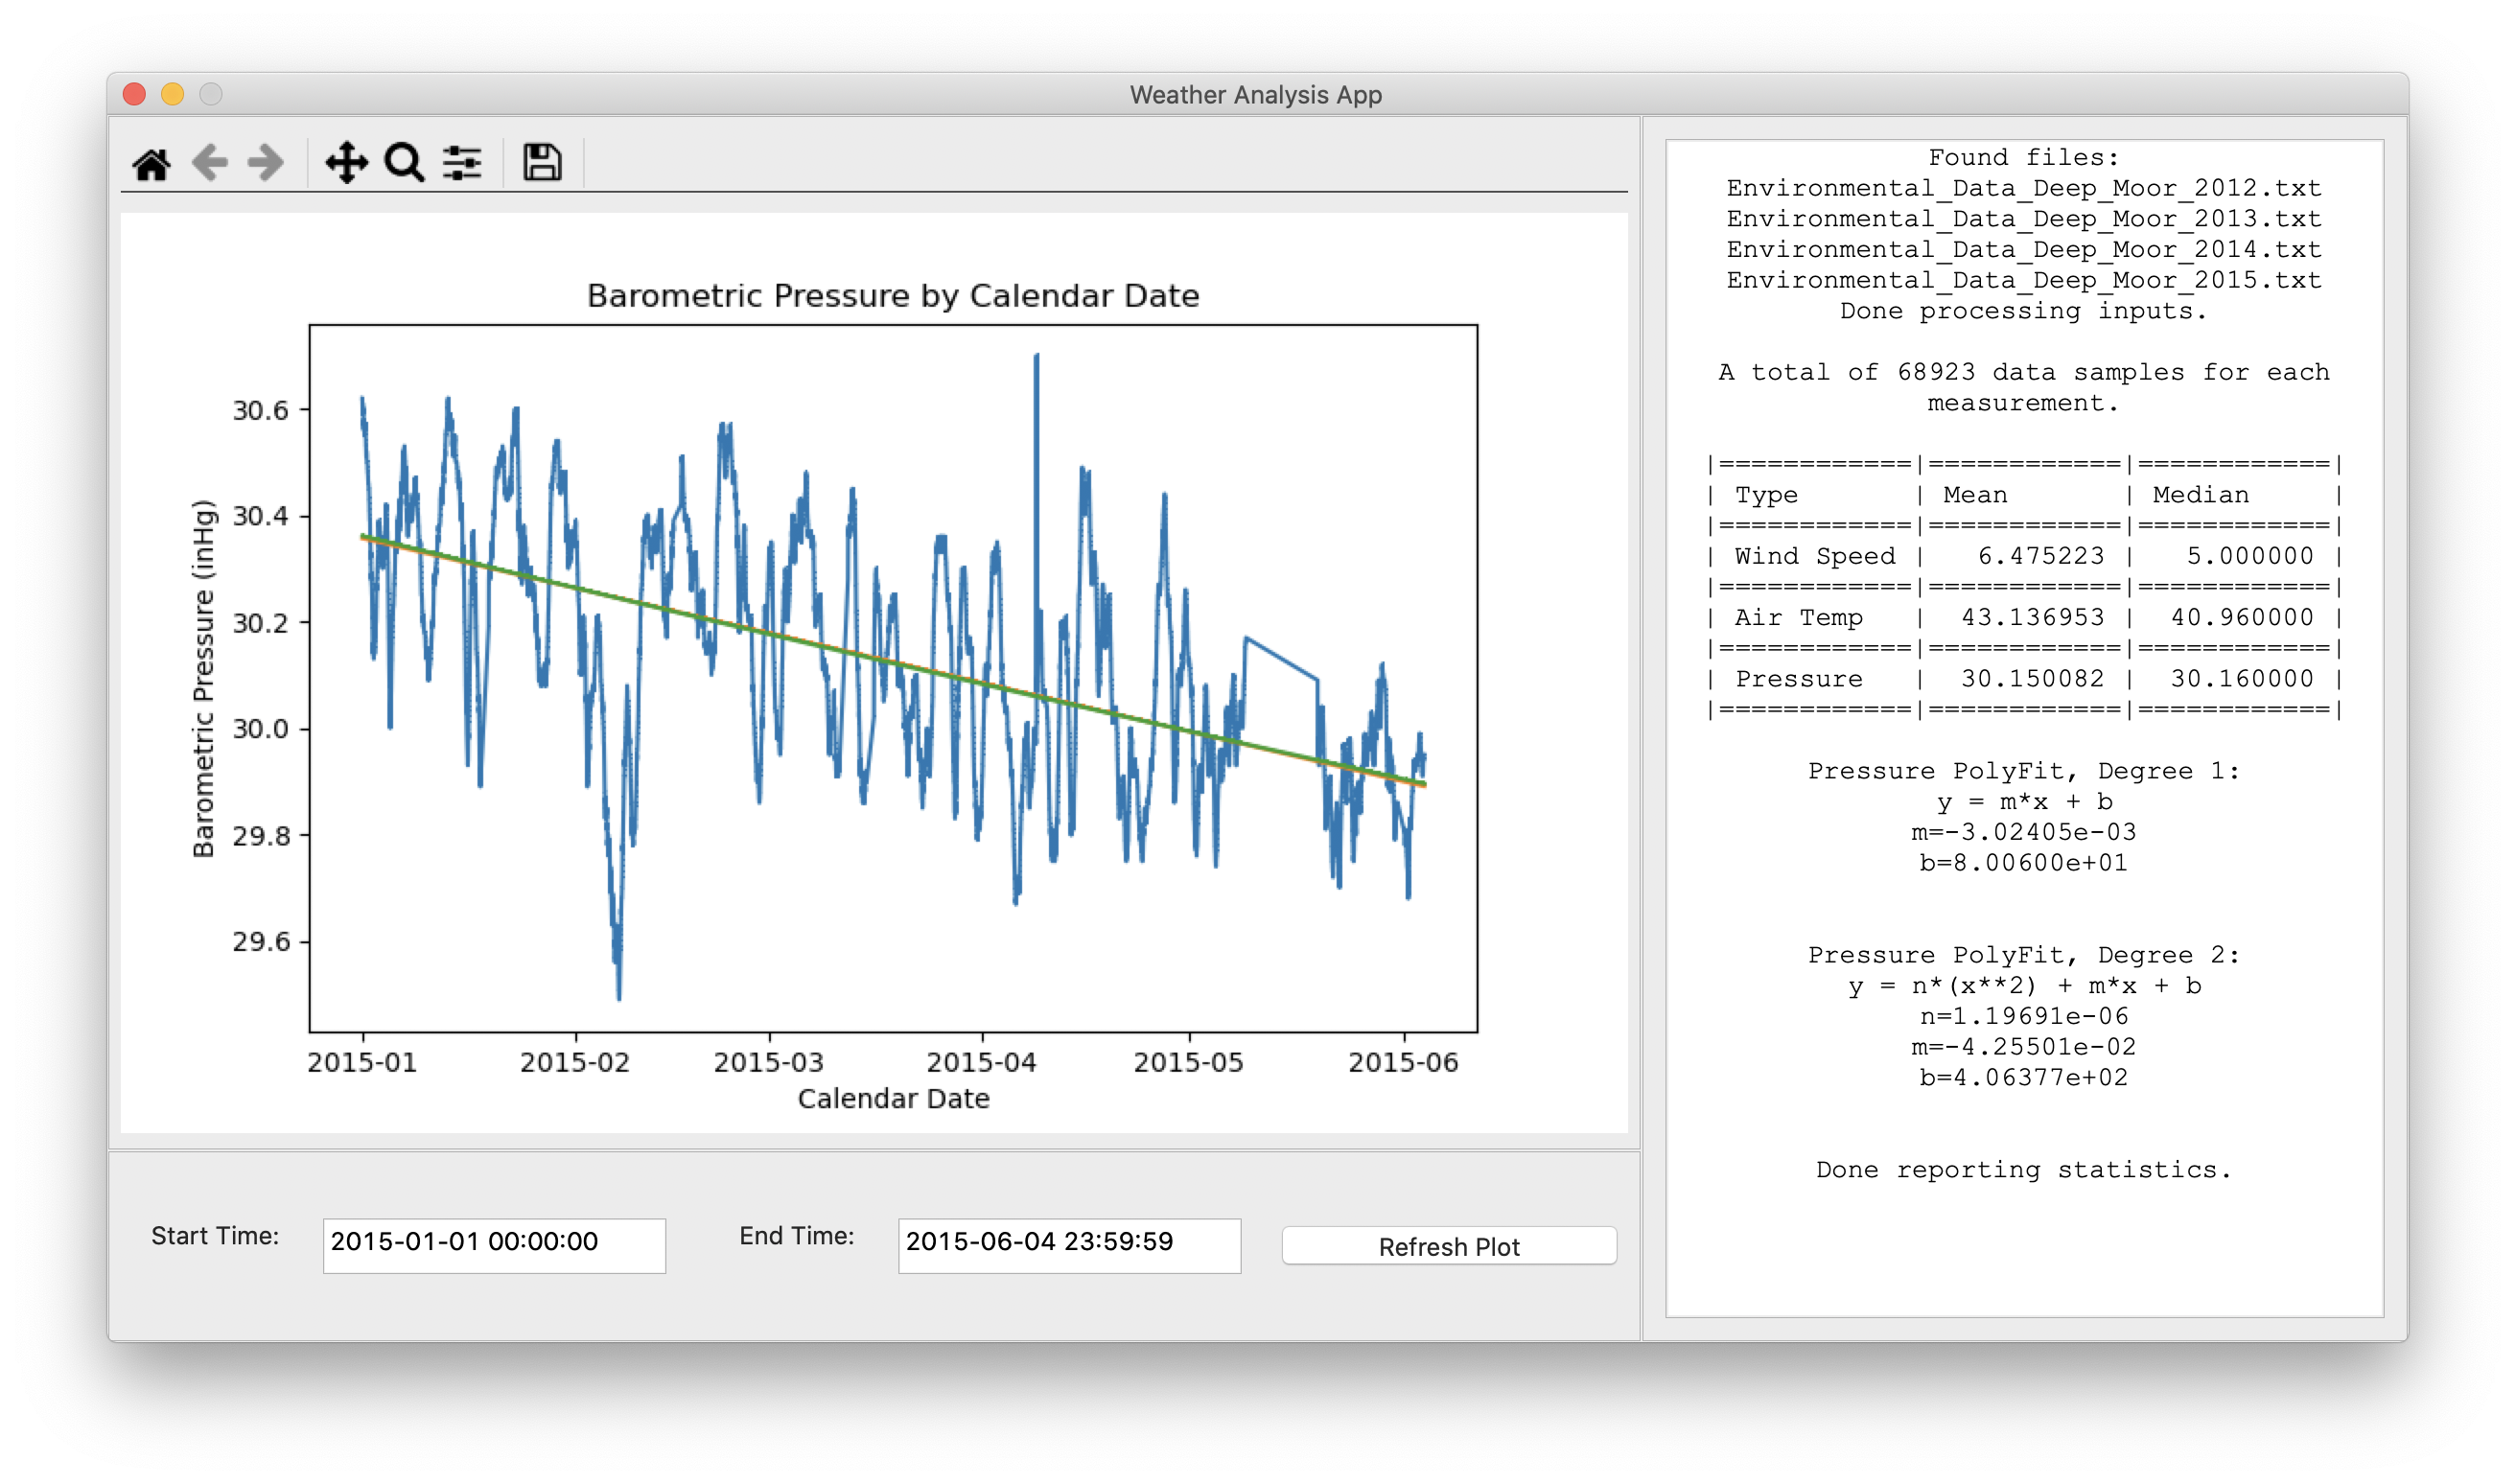
Example screen shots of the completed application:
Weather Analysis App on Ubuntu 18.04 LTS.
Weather Analysis App on Windows 10 Pro 20H2.
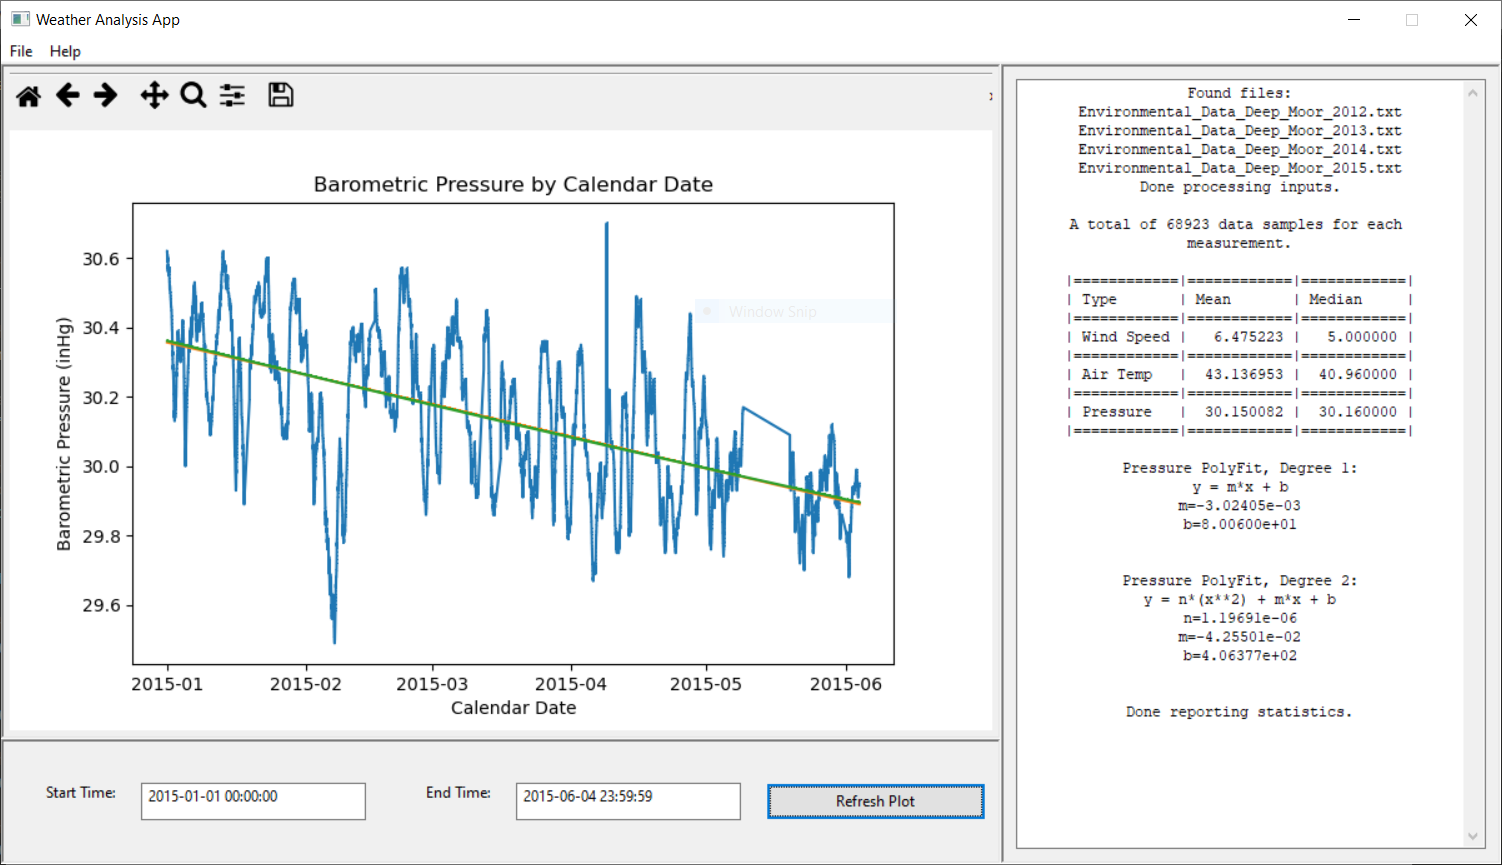
Weather Analysis App on macOS Catalina.
Hints for cross-platform design
Observations on the Polyfit regression coefficients
It is noteworthy that the coefficients are different between this Python 3 application and the previously discussed C++ application. This is due to a change of date representations in the chart plotting library, Matplotlib.
Modern Epoch in Matplotlib 3.x
As a consequence, the Polyfit for degree 1 will return the same (or almost the same, due to algorithm differences) coefficient for the line slope, but a different intercept value.
Installing wxPython
pip install wxPython
For macOS 10.15 and Windows 10 a Wheel package can be downloaded by pip to
provide the necessary binaries of wxWidgets 3 to support the wxPython 4.
For Ubuntu Linux, the pip command will attempt to compile wxWidgets and
wxPython from source. The wxPython 4 wheel may not compile correctly if your
system is not configured for from-source compilation. By passing
the argument -v to pip install the compilation process will be visable.
WARNING remarks from the ./configure script reveal what headers are required
to be installed via the Ubuntu apt-get package management. This can include
the g++ compiler, as well as
headers for secure, libtiff, libjpeg, gtk 3.0, gstreamer 1.0,
libnotify and more. On Ubuntu, the command dpkg-query --list can be used
to view what packages are installed, and give clue as to which headers of which
version of an already installed library should be downloaded.
Selecting the font size and type, of a wx.TextCtrl
       if platform.system() == 'Darwin':
            font_point = 14
        else:
            font_point = 10

        if platform.system() == 'Windows':
            windows_font_info = wx.NativeFontInfo()
            windows_font_info.FromString("1;9;-12;0;0;0;400;0;0;0;0;0;0;2;48;Courier New")
            windows_font_obj = wx.Font()
            windows_font_obj.SetNativeFontInfo(windows_font_info)
            self._fld_calculation.SetFont(windows_font_obj)

        else:
            self._fld_calculation.SetFont(
                wx.Font(font_point, wx.FONTFAMILY_TELETYPE, wx.FONTSTYLE_NORMAL,
                wx.FONTWEIGHT_NORMAL, False, "Courier New", wx.FONTENCODING_UTF8))
Running the wxPython 4 application with main loop
Note that the following method of constructing a wx.App and running its
MainLoop() call interferes with the Spyder 4 IDE debugging. The command-line
debugger can still be invoked by adding the pdb argument to the python
invocation: python3 -m pdb weather_app.py
#!/usr/bin/env pythonw
#
"""This module when called as main instantiates the Weather Statistics
Application."""
import wx
import weather_frame

DEBUG_WX_FRAME = False

class WeatherApp(wx.App):
    """This class when instantiated and .MainLoop() called, executes a wxpython
application for interactive weather statistics computation."""

    def __init__(self):
        """Instantiate a WeatherApp object that controls the execution of this
wxpython application."""
        super(WeatherApp, self).__init__()
        self._frame = None

    def OnInit(self): # pylint: disable=invalid-name
        """Called when this wxpython app is initialized and starts main
loop."""
        self._frame = weather_frame.WeatherFrame(None)
        self._frame.Show()
        return True

# Executed when the weather_app module is called directly as a script.
if __name__ == "__main__":
    app = WeatherApp()
    if DEBUG_WX_FRAME:
        wx.lib.inspection.InspectionTool().Show()
    app.MainLoop()
Running the Python app with Framework support on Ubuntu
$ which python3
/home/timothystotts/anaconda3/bin/python3
$ python3 weather_app.py
Running the Python app Framework support on macOS 10.15
$ which pythonw
/Users/timothystotts/opt/anaconda3/bin/pythonw
$ pythonw weather_app.py
Running the Python app Framework support on Windows 10
Run the Anaconda3 Powershell Prompt
python weather_app.py